The first graph below shows each type of jurisdiction's percentage share of
the total property tax burden over the relevant time frame. The
second shows the absolute amount of property taxes collected by each type of
jurisdiction. Tables containing the data underlying the
graphs follow.
Shares of Net Tax by Type of Jurisdiction
2009-2023
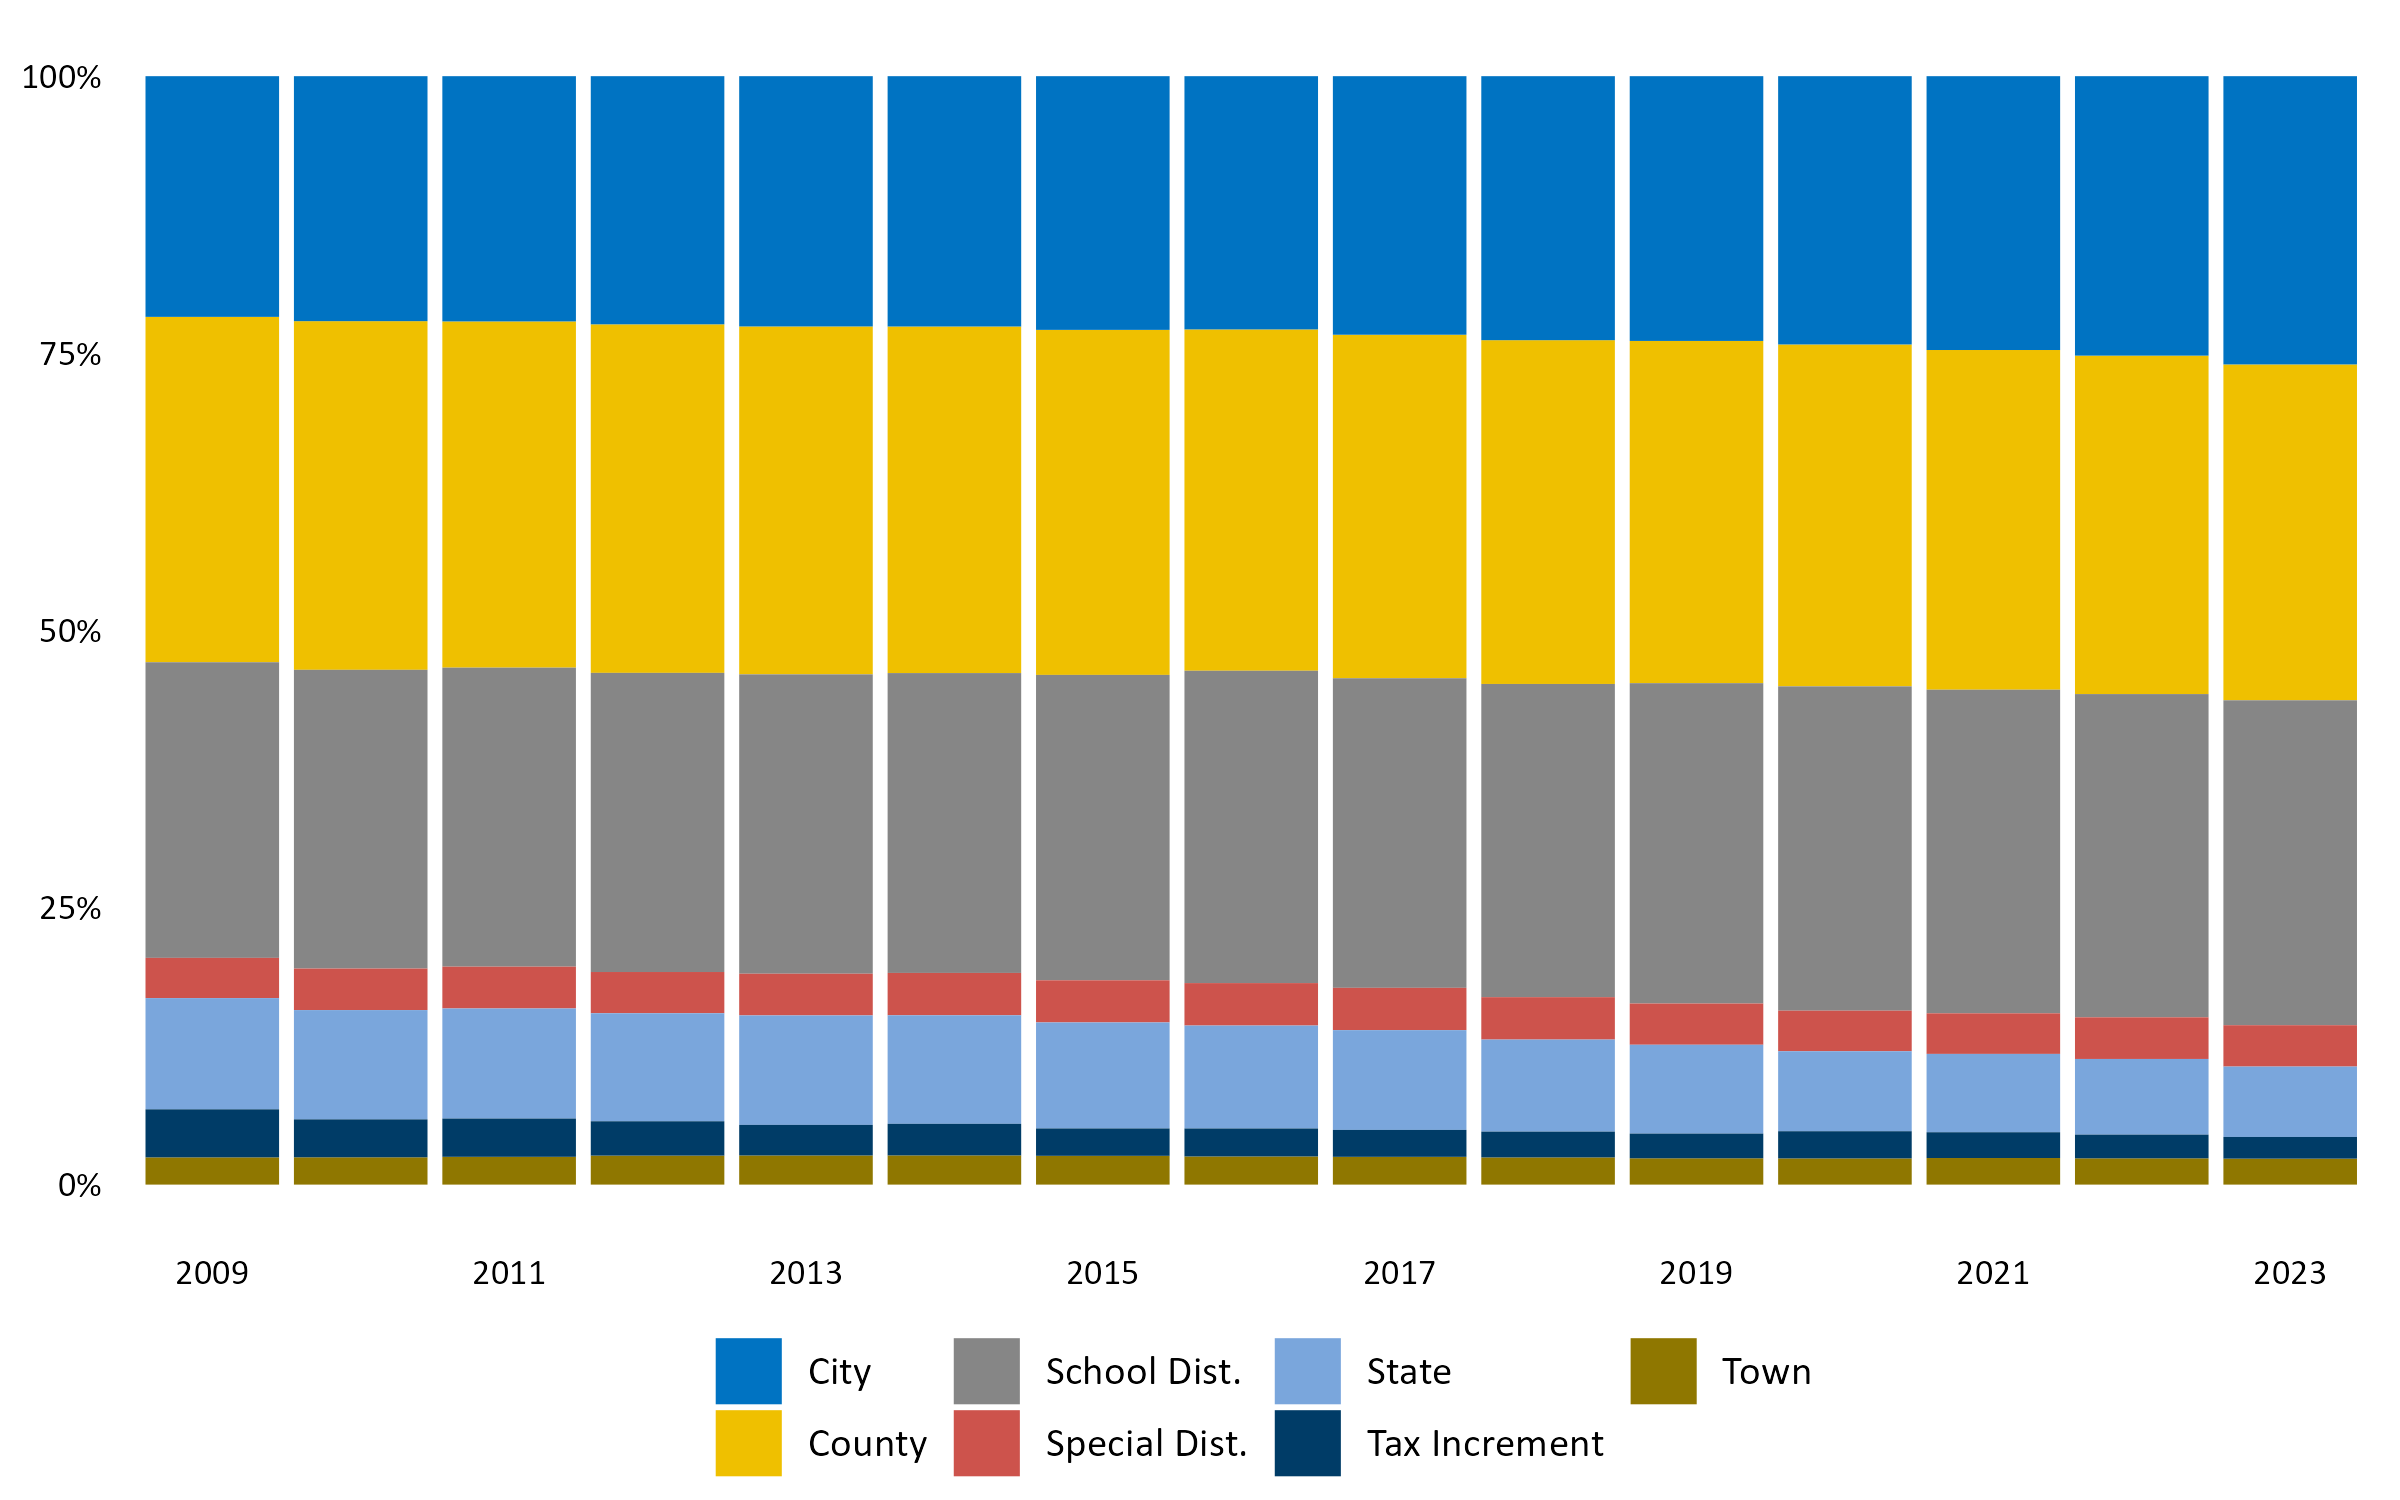
Note: "Special taxing districts" include all government jurisdictions other than
counties, cities, towns, and school districts with authority to levy property
taxes; they include watershed districts, housing and redevelopment authorities,
regional rail authorities, and the Metropolitan Council and other regional
government entities.
Net Tax by Type of Jurisdiction (millions)
2009-2023
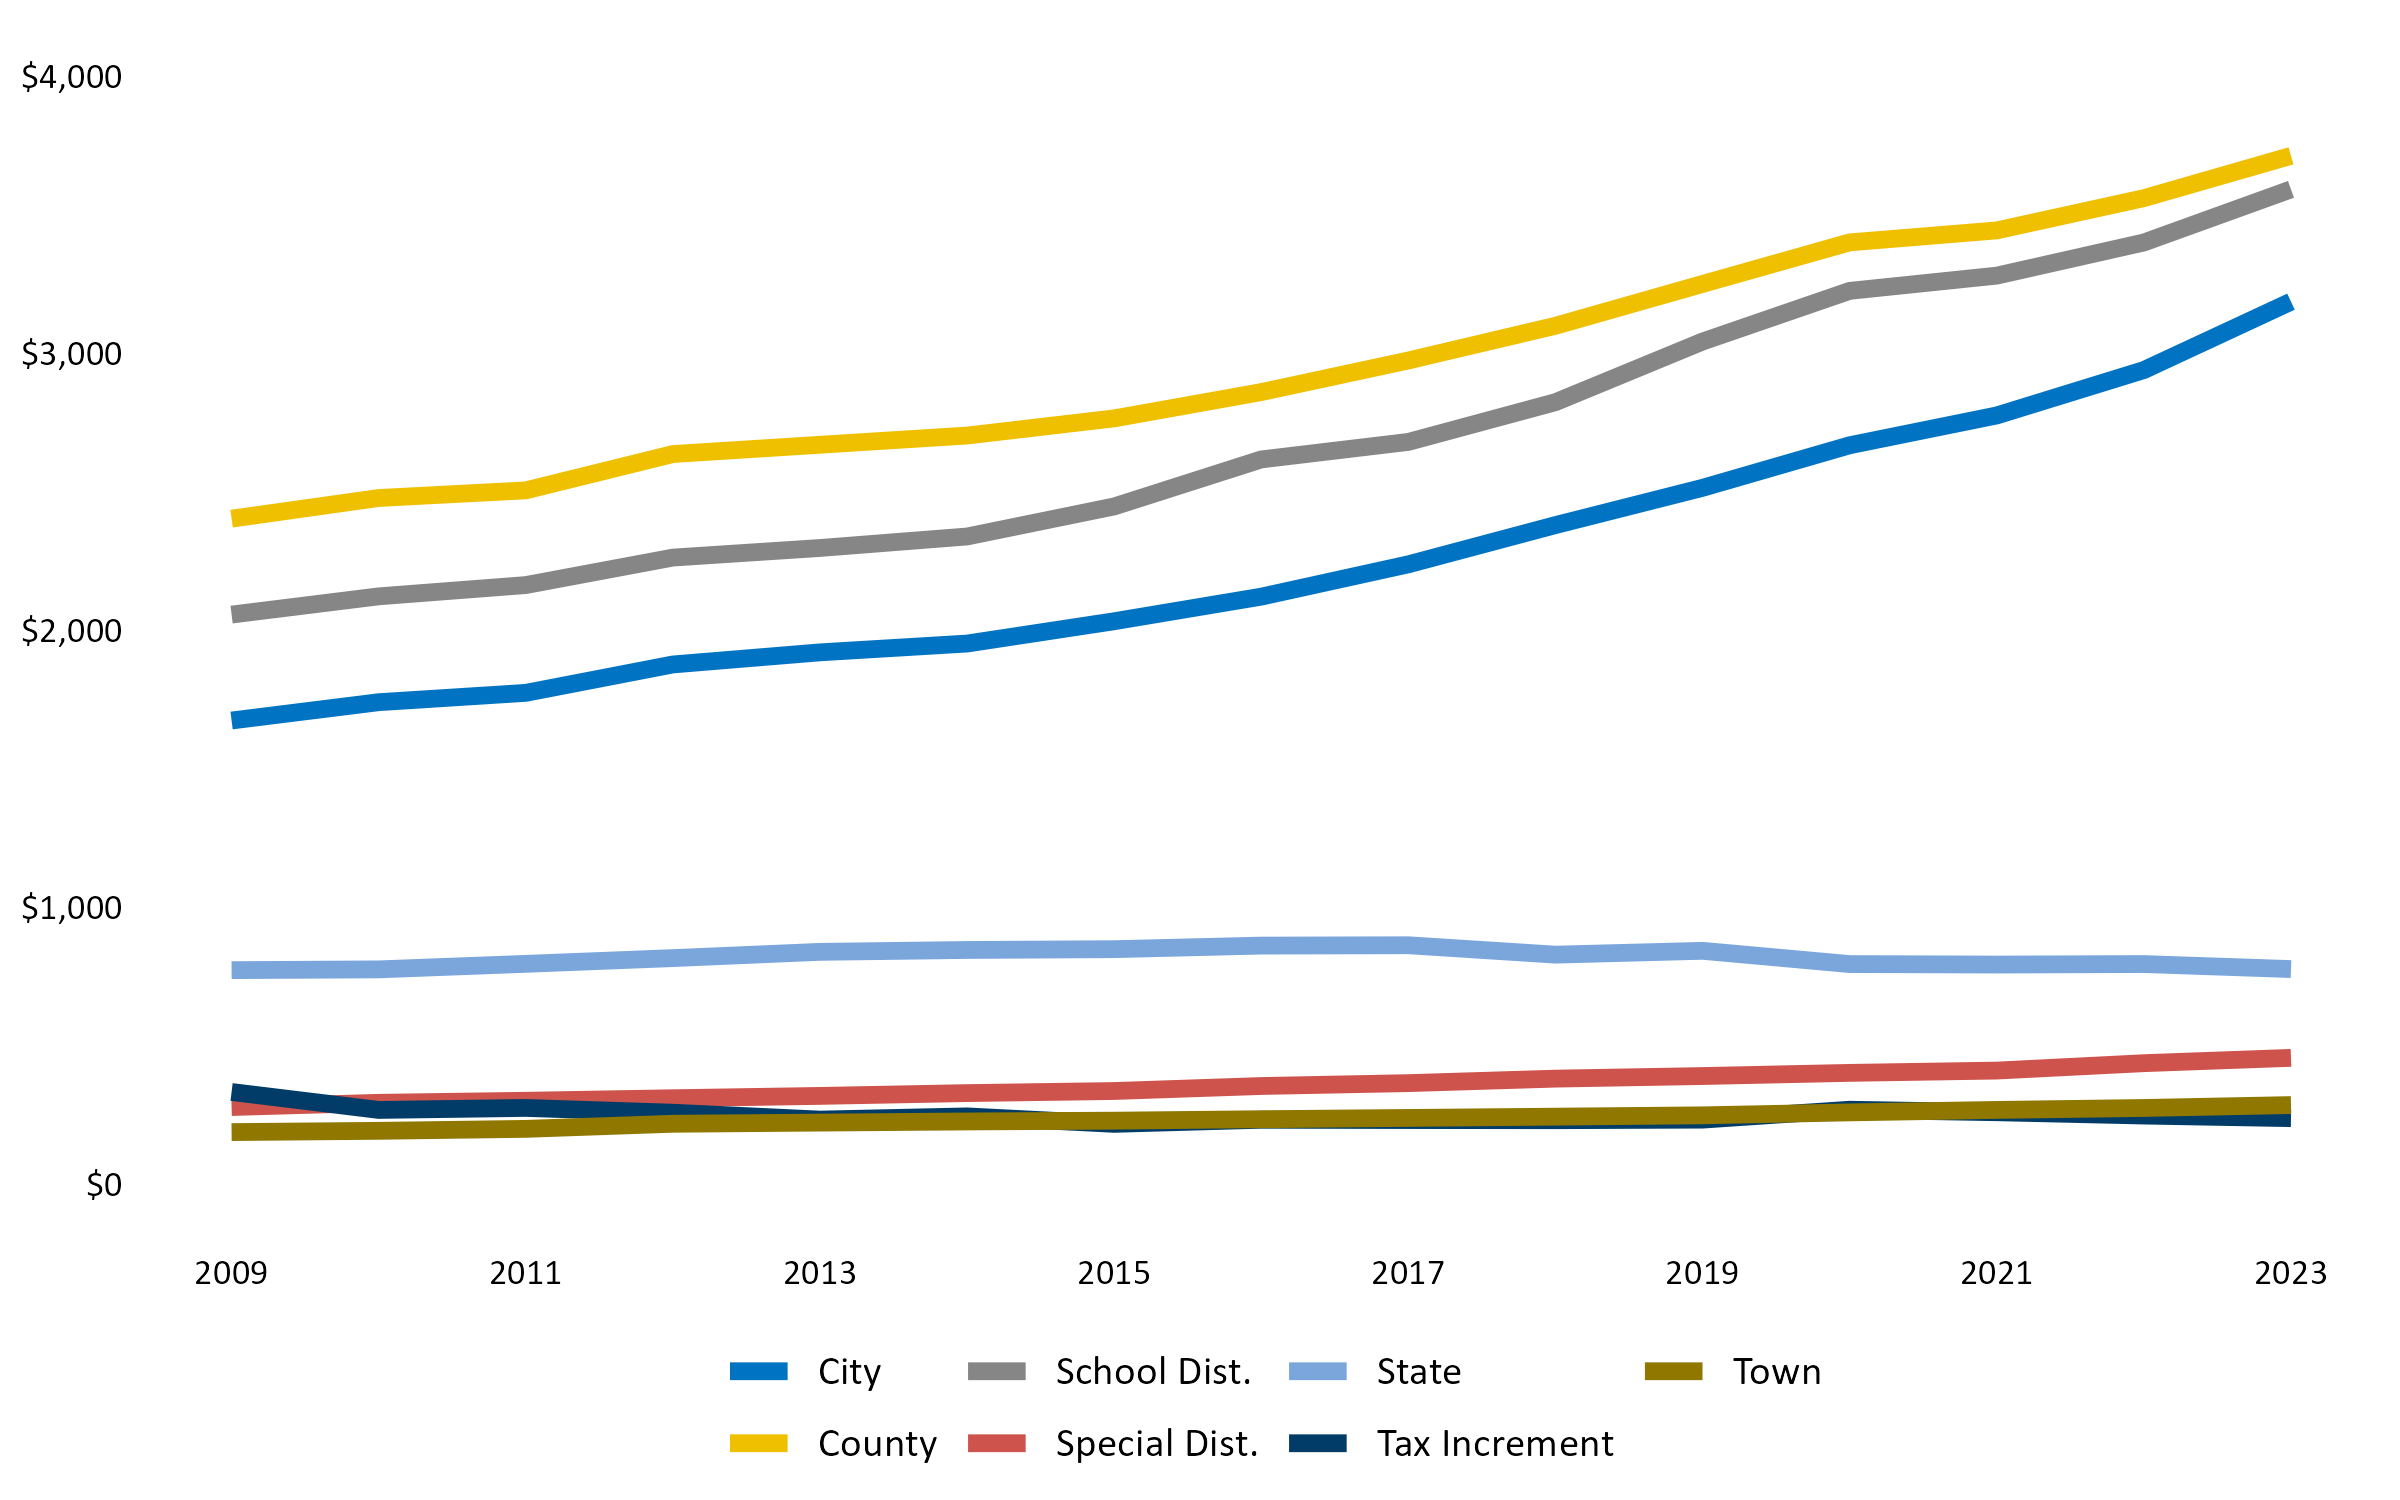
Note: "Special taxing districts" include all government jurisdictions other than
counties, cities, towns, and school districts with authority to levy property
taxes; they include watershed districts, housing and redevelopment authorities,
regional rail authorities, and the Metropolitan Council and other regional
government entities.
Net Property Tax Revenues by Type of Jurisdiction (millions)
2020-2023
| Net Taxes |
Payable Year |
| 2020 |
2021 |
2022 |
2023 |
| County |
3,400 |
3,443 |
3,560 |
3,712 |
| City |
2,668 |
2,776 |
2,939 |
3,186 |
| Town |
261 |
270 |
276 |
287 |
| School District |
3,225 |
3,280 |
3,400 |
3,592 |
| Special District |
403 |
411 |
438 |
457 |
| State |
796 |
794 |
796 |
778 |
| Tax Increment |
270 |
261 |
249 |
240 |
| Total |
11,023 |
11,236 |
11,659 |
12,252 |
2017-2019
| Net Taxes |
Payable Year |
| 2017 |
2018 |
2019 |
| County |
2,974 |
3,099 |
3,250 |
| City |
2,238 |
2,380 |
2,514 |
| Town |
241 |
245 |
250 |
| School District |
2,680 |
2,824 |
3,042 |
| Special District |
366 |
382 |
392 |
| State |
864 |
830 |
844 |
| Tax Increment |
233 |
232 |
234 |
| Total |
9,596 |
9,993 |
10,527 |
2013-2016
| Net Taxes |
Payable Year |
| 2013 |
2014 |
2015 |
2016 |
| County |
2,670 |
2,703 |
2,765 |
2,859 |
| City |
1,921 |
1,953 |
2,033 |
2,122 |
| Town |
224 |
228 |
231 |
236 |
| School District |
2,297 |
2,339 |
2,447 |
2,618 |
| Special District |
320 |
330 |
338 |
356 |
| State |
840 |
847 |
850 |
863 |
| Tax Increment |
235 |
246 |
219 |
234 |
| Total |
8,506 |
8,646 |
8,883 |
9,288 |
2009-2012
| Net Taxes |
Payable Year |
| 2009 |
2010 |
2011 |
2012 |
| County |
2,403 |
2,478 |
2,505 |
2,636 |
| City |
1,675 |
1,741 |
1,775 |
1,877 |
| Town |
190 |
194 |
201 |
220 |
| School District |
2,057 |
2,123 |
2,164 |
2,263 |
| Special District |
280 |
295 |
303 |
312 |
| State |
774 |
777 |
797 |
817 |
| Tax Increment |
334 |
269 |
277 |
259 |
| Total |
7,713 |
7,877 |
8,020 |
8,384 |